|
To Make Charts and Graphs on Powerpoint
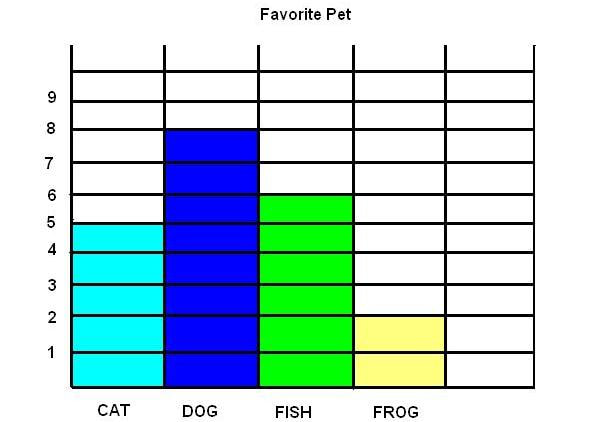
1. Open up Powerpoint. 2. On the tool bar, click on the bar graph like the first picture on the side. 3. You will notice that a whole new tool bar appears. 4. Click on the drop down arrow next to the area chart (the graph that looks like mountains). Here you will find different graphs.Just click on the one that you want. PPT will change your graph to this type of graph. A. Horizontal bar graph B. Vertical bar graph C. Pie Graph 5. If you want to add grid lines to your graph click on one of the two pictures that look kind of like combs. 6. Insert a test box to add a title to your graph. 7. Print To Change Information on the Datasheet 1. Click on the datasheet. 2. Change information on the datasheet. The program will automatically change it on the graph. *To the right is a sample of a bar graph made on Powerpoint. These directions might change depending upon which version of Powerpoint that you have. |
#2 #4 Horizontal bar graph
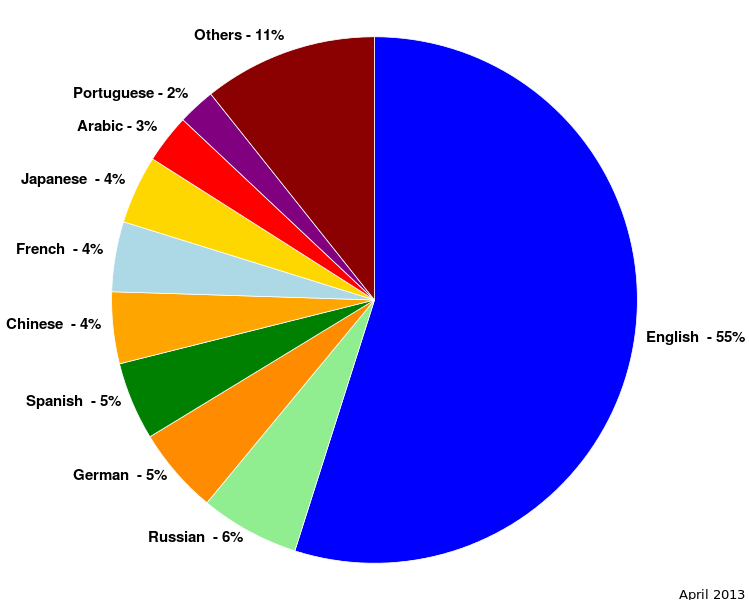
Vertical bar graph Pie graph
|